summary
What are Control Charts?
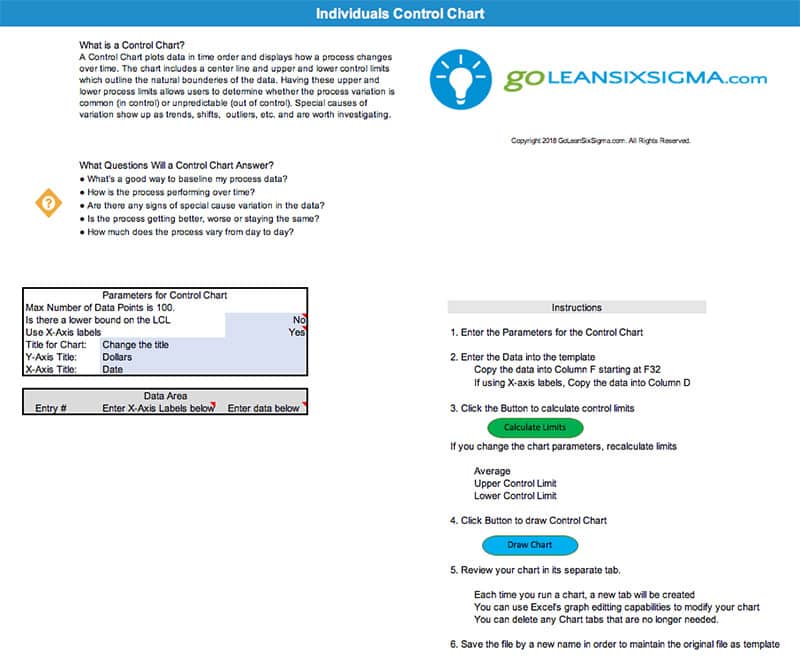
Control Charts are time charts designed to display signals or warnings of special cause variation. Special cause variation, as distinct from common cause variation, refers to changes in process performance due to sporadic or rare events indicating that a process is not “in control.” The advantage of Control Charts is that they enhance the understanding of process variation making it easier to take action to reduce special cause variation and improve ongoing process performance.
Graphically, they feature points that represent project mean or variation, and upper and lower Control Limits. The location of these points determines if a project is “out of control” and under the influence of common or special causes.

For a better understanding of the Control Chart, check out our Black Belt Training & Certification.